Count Product Wins when Customers Take a Valuable Action
In the many of metrics at our disposal, only one metric truly matters: our product wins. As a product leader, I count a win whenever we “grow” our ideal customer.
I’m a baseball fan (Go-O’s), so imagine product metrics as baseball stats: plenty are interesting, but only the wins genuinely count. Baseball savants developed a complex field of baseball analytics to measure how many “wins” an individual player contributes. In our case, product “Wins” in our field mean the number of customers using our products as we designed them.
Sidebar: Everything good in business comes from a customer or potential customer taking a specific action. That’s what matters in business, so track it as your “Win.” Do you know your winning metric? If not, now is an excellent time to explore.
These customers aren’t just taking any action—they are taking actions that reflect deep engagement and utility. These are customers that your product has won.
At Twilio, a win could be clients making 100K daily calls for more than one product. During my time at Nordstrom, I measured the number of users who returned and engaged with my product 14 days out of 28. These are not measures for the faint of heart; these are wins. You’ll find that these Core Customers are the lifeblood of the product; though a small segment, they account for at least 40% of your revenue; specifically, they drive all future product growth.
But Core Customers aren’t a spontaneous phenomenon; they grow. They develop from a gradual increase—of compounding behaviors that all teams need to nurture and understand.

A common hang-up is what to do about Non-Core Customers. Does that mean they don’t matter? Of course not. Non-Core Customers contribute in one of two ways: every Non-Core customer is a potential future Core Customer, but further, Non-Core Customers are necessary for driving scale in many markets. Without Non-Core Customers in most markets, you won’t have sufficient volume to serve your Core Customers. The challenge is that Non-Core Customers are high turnover; customers only stick once their behaviors stick. And until their behaviors stick, at a certain level of intensity, they aren’t a win.
Core Customers are also symbiotic with your product—the more customers use it, the more value they get from it. So, as you learn the antecedents that lead to people becoming Core Customers, the time it takes to develop, and how to aid customers on that journey, it becomes a win-win scenario.
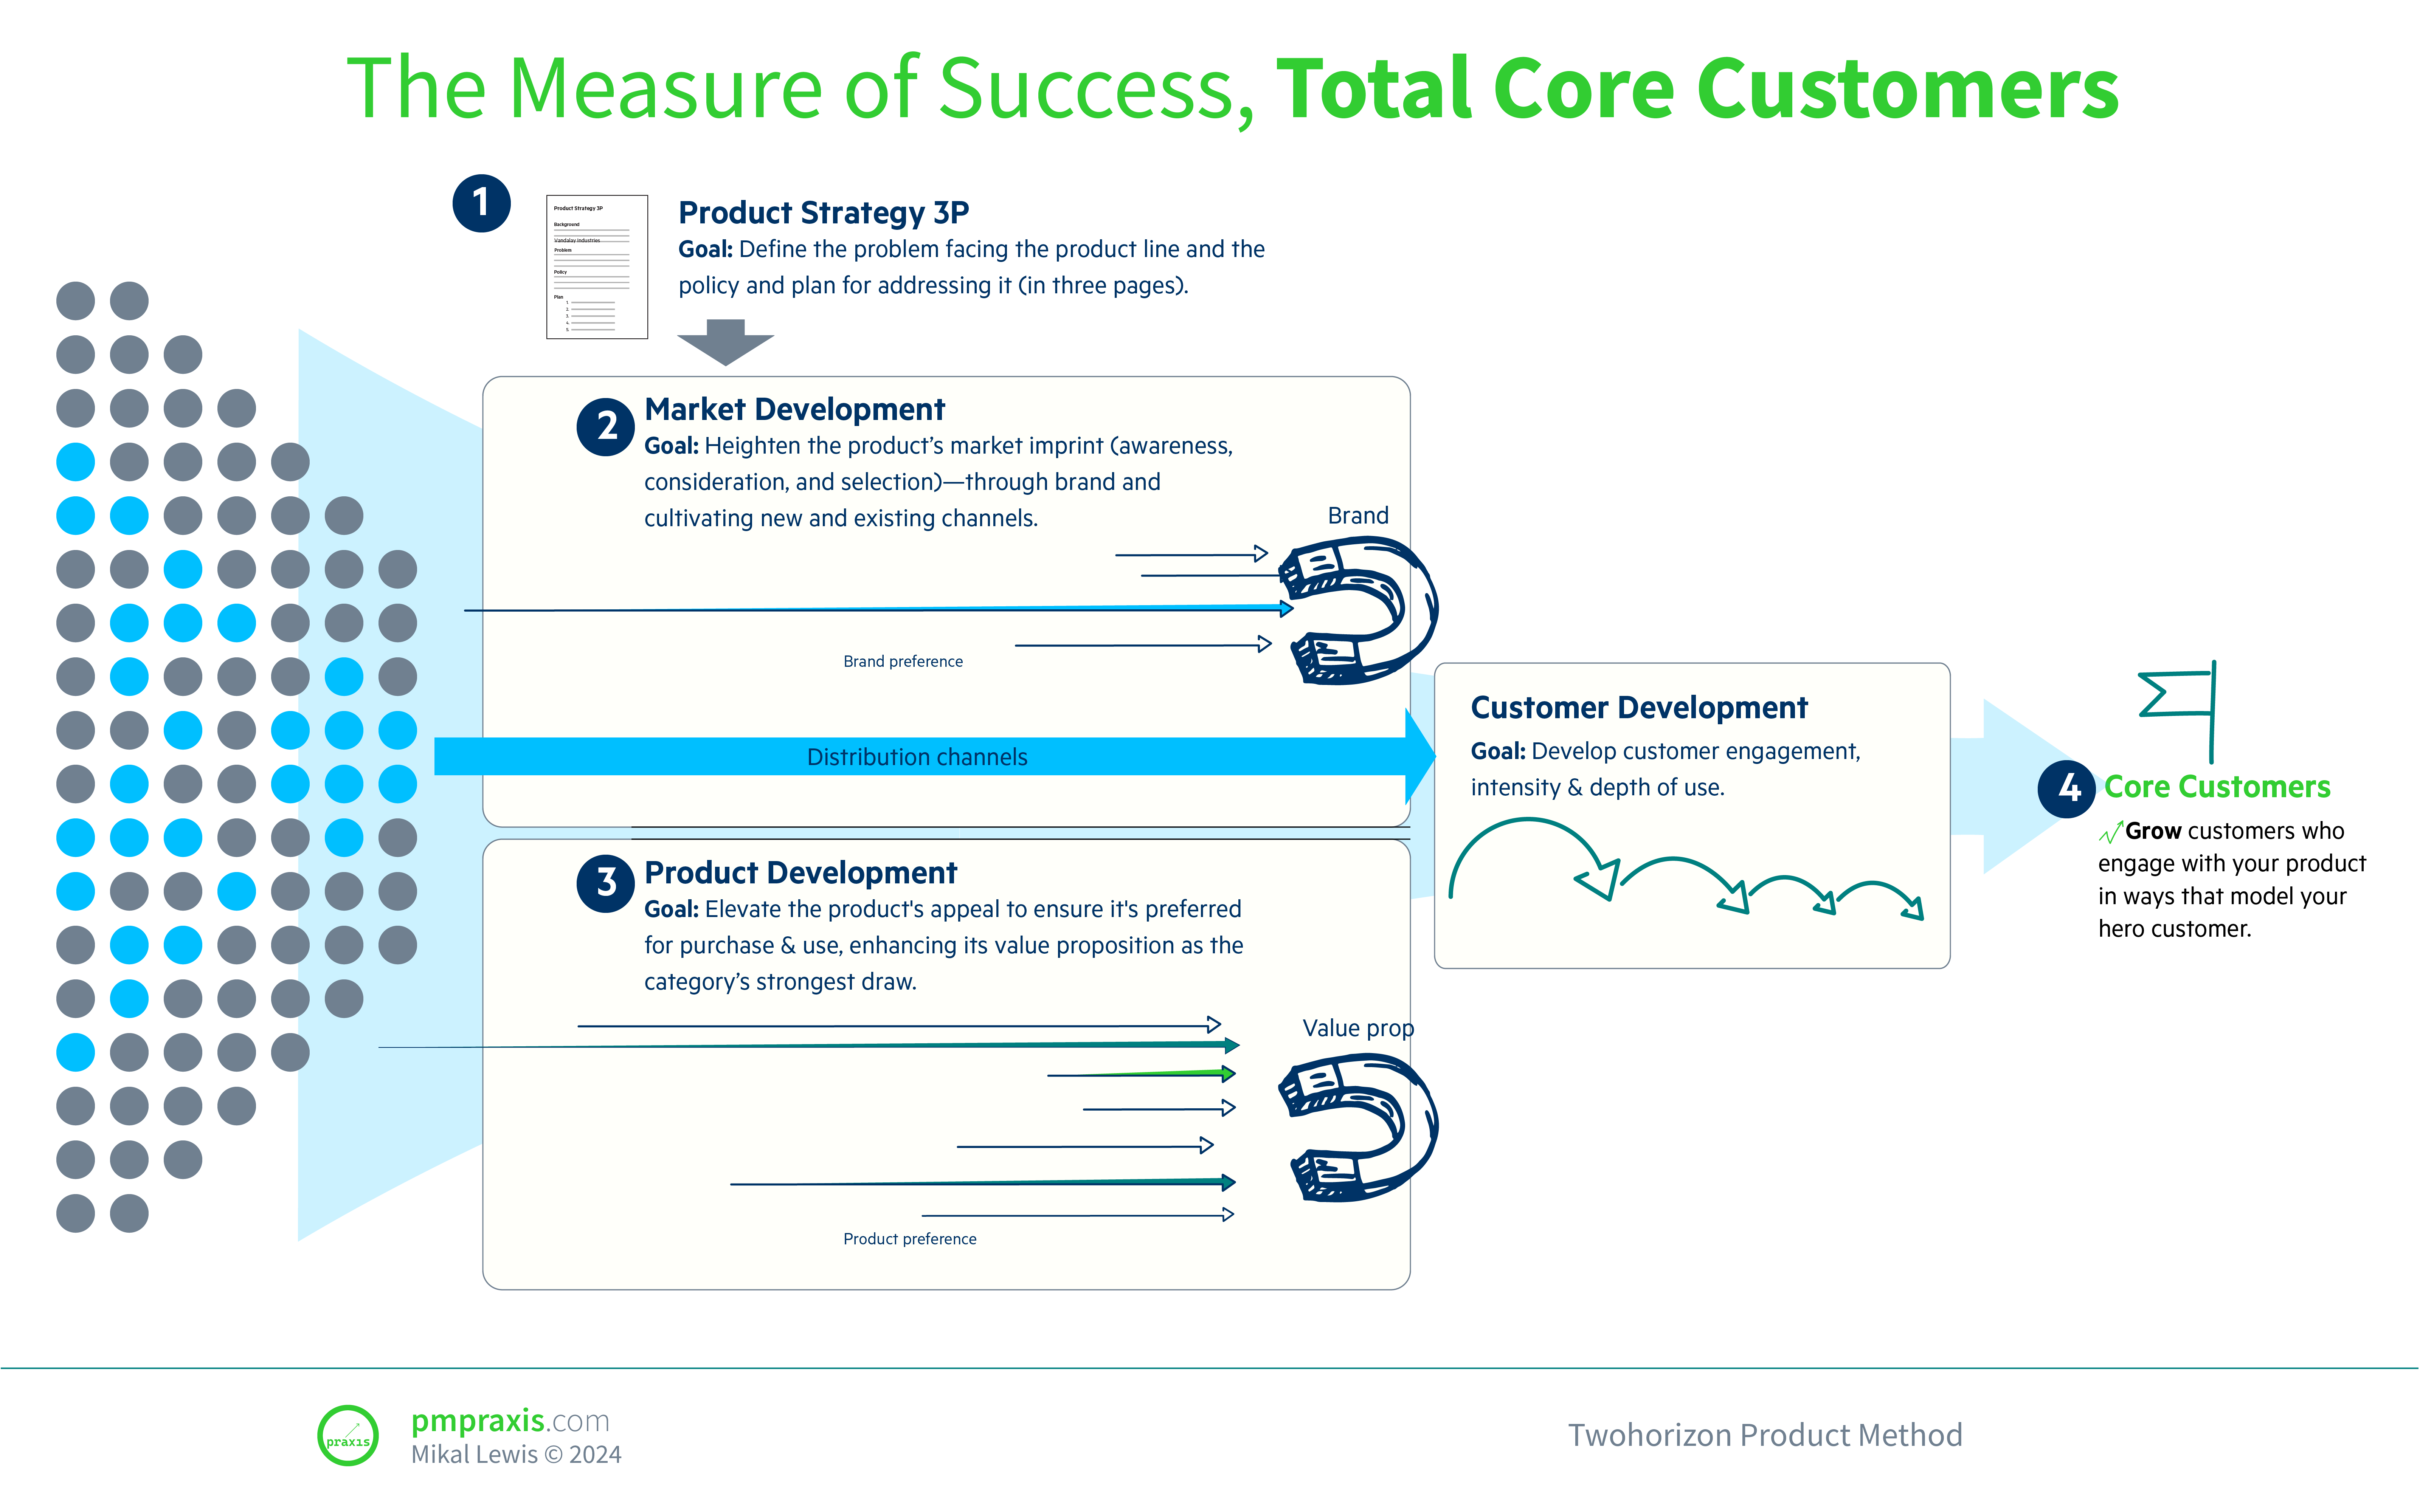
Essentially, all paths in our product landscape—from visitor to fanatic user—lead to one goal: the growth of more Core Customers. Find what counts as a Core Customer—and begin to count your wins. The rest is the journey to get there.
Example: CloudComms SaaS
CloudComms is a cloud-based communication platform offering integrated messaging, video conferencing, and collaboration tools.
Customer Segmentation and Milestones:
1. Sign-Ups (Activation):
- Monthly sign-ups: 30,000
- Conversion from sign-up to active user: 40%
- New active users post-sign-up each month: 12,000
2. Onboarding Completion (Engagement):
- Average onboarding completion rate: 70%
- Number of users completing onboarding monthly: 8,400
- Average time to complete onboarding: 3 days
3. Feature Adoption (Adoption):
- Users utilizing messaging feature monthly: 24,000 (80%)
- Users utilizing video conferencing monthly: 19,500 (65%)
- Users utilizing collaboration tools monthly: 15,000 (50%)
- Logged-in users per month: 25,000 (approximately 83% of active users
5. Regular Paid Usage (Habituation):
- Monthly paid users: 14,000
6. Expansion within Accounts (Expansion):
- Users adding additional team members: 25%
- Average number of team members per account: 5
7. Core Customer (End Users):
- Individual users on a paid plan that post five times each week using the text service and engage with at least one other service (voice or video) weekly.
- Number of Core Customer (End Users) monthly: 10,000
- Monthly Continuation Rate for Core Customer (End Users): 85%
8. Core Customer (Accounts):
- Accounts with 500 or more users actively engaging with two or more services (voice, text, and video) each week.
- Number of Core Customer (Accounts) monthly: 150
- Average Monthly Active Users per Core Customer (Account): 750
- Retention rate for Core Customer (Accounts): 98%
Leave a Reply